download PDF version - To read a PDF file you need to install
Adobe Acrobat Reader: 
April 2026
Dear Clients and Friends,
In recent quarterly updates, we noted that valuations for US stocks have been at or near all-time highs for some time. Yet stocks continued to power upward on expectations for quarter after quarter of record earnings. We also noted how concerns about massive investments in AI capital spending were causing consternation among institutional investors leading to serious concerns. In the first quarter of this year, investors found new concerns about the future viability of legacy software companies. Would rapidly improving AI models substantially impact the business of these companies? And if so, would the debt extended to software companies by the nation’s largest banks and private equity firms face repayment troubles? Software companies faced their worst quarter in years as a result. Amazingly, the stock market broadly held up despite all of these concerns. What nobody saw coming was a war in the Middle East and oil shooting north of $100 a barrel.
All things equal, stocks will climb the proverbial “wall of worry” until there is a trigger to start the selling; the war in the Middle East was that trigger in the first quarter. For the quarter, the S&P500 fell -4.6% while the NASDAQ fell -7.1%. More notable, the major indexes had drawdowns from their peaks of around -10%. Almost all the declines occurred in the latter half of the quarter, triggered by the war, and specifically angst about high oil prices and volatility in the bond market where interest rates shot higher, showing unusual levels of volatility.
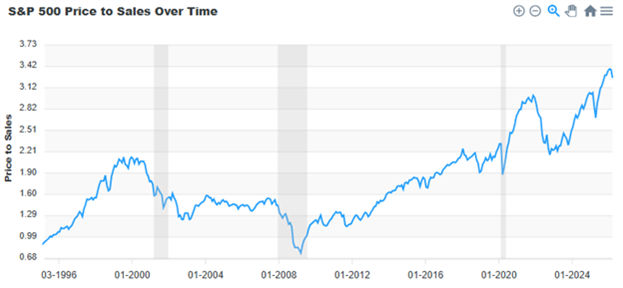
The Price-Sales Ratio for the S&P500 is ~50% Higher than the Dot Com Peak
It’s difficult to cover the innumerable ways in which rapidly rising oil prices and interest rates impact the US economy, but they are severe and most certainly not good. Oil impacts nearly every corner of the economy as transportation costs affect the movement of all goods, especially food, and travel, where energy costs are the single largest variable input to prices. Perhaps of greater impact, Interest rates had been forecast to fall this year, a scenario that seems far less likely now. The US housing market was already struggling under the stress of high interest rates and now likely will remain stalled. As company expenses rise due to higher interest rates and transportation costs, further belt-tightening is likely as companies attempt to maintain sales targets. A clear area for expense cutting has, and likely will continue to be, reductions in headcount. Layoffs will the lead to increased consumer debt and lower consumer spending, which powers 2/3 of the US economy. The real danger here is a doom loop where cutting just begets more cutting. Already, several brokerage firms and economists have significantly increased their forecasts for a recession in the next 12 months.
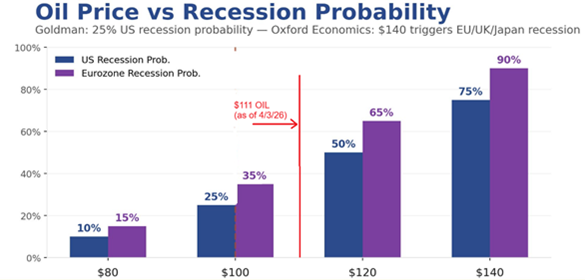
While a recession may or may not occur, with the outcome heavily dependent on where the price of oil stabilizes, the trend toward de-risking is clear and warrants caution. Very recently, a ceasefire in the war in the Middle East has been agreed, however oil prices are still 75% higher than only 2 months ago. Given the destruction of oil production and transport infrastructure, primarily in the Middle East, but secondarily in Russia, it’s quite clear oil is not going back to $55 per barrel anytime soon. Economists generally believe that the US could muddle through with oil prices in the $90ish range. But they agree that if oil stays above $100 on a sustained basis, this will present substantial challenges for the US economy and the stock market.
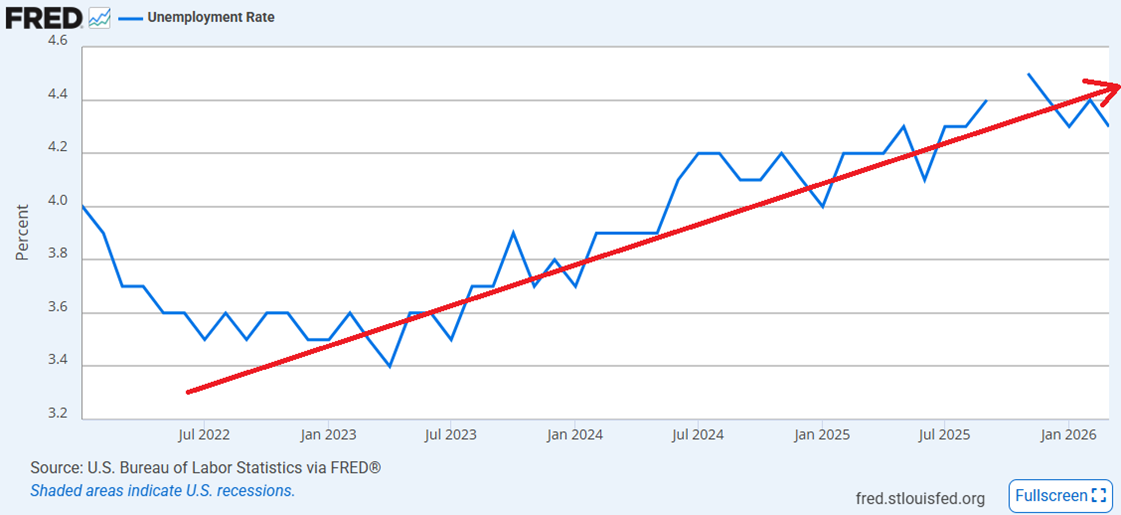
If you haven’t already, you are likely to hear talk about “stagflation.” Stagflation is an economic condition when inflation is elevated, unemployment rises and economic growth slows. New inflation data released April 10th showed inflation running at the highest rate in 4 years, well above the GDP growth for the economy. With inflation running hot, the Federal Reserve will temper their plans for rate cuts this year, with some economists forecasting no rate cuts at all.
Unemployment Rising Steadily Since Mid-2022
Investors have been quick to point out that the stock market took a huge tumble in the spring of 2025 on the unleashing of Trump’s tariffs only to come roaring back, pushing to new all-time highs later last year. Investors may want to temper their enthusiasm a bit this time. While oil prices may drop back somewhat, they are likely to remain quite high. And the macro-economic environment is changing in a number of significant ways. While AI is booming, AI leaders have moved in many cases to financing data centers with debt, off-balance sheet funding, or leases from other companies that are 100% debt financed. With interest rates high, and recently rising, this could put some companies, and eventually the US economy, in a tenuous situation down the road.
Corporate earnings are forecast to deliver huge growth this quarter. Investors will be listening very closely to earnings calls this month and next for signs that the AI impact is overstated and that the rise in energy costs will have limited impact on future earnings. If investors can become convinced of those two things, the wall of worry currently in place could lead to another push higher for stocks. If not, high market volatility will continue with stocks treading water at best.
Fortunately, we have strategies to mitigate these risks and their impact on your investments. For many accounts, your recent quarterly statements demonstrate that your investments did not suffer the painful drawdowns that many investors suffered. As you know, we invest your money right alongside our own money, starting from the fundamental philosophy that a good offense always starts with a strong defense. We are grateful and humbled to be a trusted caretaker for your investments, and thank you for the many referrals we have received in recent months.
To future profits,
 Don Lansing Chief Investment Officer. 512-289-0620 |
 Garrett Beauvais Portfolio Manager 512-796-0233 |
download PDF version - To read a PDF file you need to install Adobe Acrobat Reader:
Thank you for your time and interest!
To obtain more information or to schedule a FREE personal consultation so you may fully understand the benefits our clients receive, please contact us at:
| Phone: | (512) 255-8722 |
| Email: | info@markettrendadvisors.com |
| Business hours: | Monday through Friday 8:00am to 5:00pm Central Standard Time |
MARKETTREND Advisors, Ltd.
9508 Topridge drive
Austin TX 78750
MarketTrend Advisors is an investment advisory firm that specializes in the trend-following strategies outlined in this report. We offer a variety of strategies that can be used to build portfolios to meet almost any investment objective. We divide our strategies into two main groups: "Long" strategies and "Trend" strategies. The Trend strategies follow the trend up or down. The "Long" strategies are typical investment portfolios that usually remain fully invested, potentially raising cash or moving to income-focused investments when the market is weak. We have a variety of "Long" strategies depending on how aggressive or conservative you want to be. These strategies will make their money when the market is moving higher. The "Trend" strategies will provide protection in a down market and add to gains in an up-trending market. By combining the Long and Trend strategies you get all the components needed to build a successful long-term portfolio:
- A portfolio invested in the best performing indexes, ETFs, or stocks
- Substantial exposure to global growth through international holdings
- Protection for your overall portfolio from down-trending markets When the market is going up, you benefit as aggressively as you wish.
Disclaimer
- MarketTrend Advisors, Ltd. is an independent registered in the States of California, Florida, New York and Texas.
- Other Securities Industry Affiliations or Activities. MarketTrend Advisors, is not registered as a broker or dealer, nor do we have any partners or employees who are affiliated with any broker or dealer. See Form ADV, Part II for official declarations.
- MTA portfolio strategies assume risk and no assurance is made that investors will avoid losses. No representation is made that clients will or are likely to achieve profits or incur losses comparable to those shown. Performance results are shown for illustration and discussion purposes only. The performance information has not been audited. However, the information presented is believed to be accurate and fairly presented. All performance figures in this presentation are net of management fees and commissions. Management fees are charged to actual client accounts on a monthly basis. Accounts include both taxable and non-taxable IRA accounts.
- Regarding the MTA Blend strategy: This strategy was migrated into the MTA Wealth Builder strategy and closed in December 2008.
- Regarding actual performance: Actual performance for all strategies includes all commissions as well as management fees (fees range from 1% to 2%). Actual performance statistics are based on the inception date of each strategy through the end of the last business day of the most recent month listed in the monthly performance section of this report. Starting with Q4, 2006, returns include only assets of Fidelity clients who were fully invested in their respective strategies. Returns before Q4, 2006 include all Fidelity client assets regardless of investment status. Results do not include the assets of clients at other brokerage firms.
- Regarding future performance: Past performance may not be indicative of future results. Therefore, you should not assume that the future performance of any specific investment or investment strategy will be profitable or equal to corresponding past performance levels.
- S&P 500 refers to the Standard & Poor's 500 Large-Cap Corporations Index. The index is designed to measure performance of the broad based US market and consists of 500 American companies. This index is used for comparative purposes only. (Data is taken from Yahoo! Finance.)
- MarketTrend Advisors is not liable for the usefulness, timeliness, accuracy, or suitability of any information contained in its web site or of any of its services. The user understands that the information given can and will fail to predict the direction and magnitude of market price movements and the user can lose money when using this information.
